Posts

Update on COVID 19 tracking in SA

Image
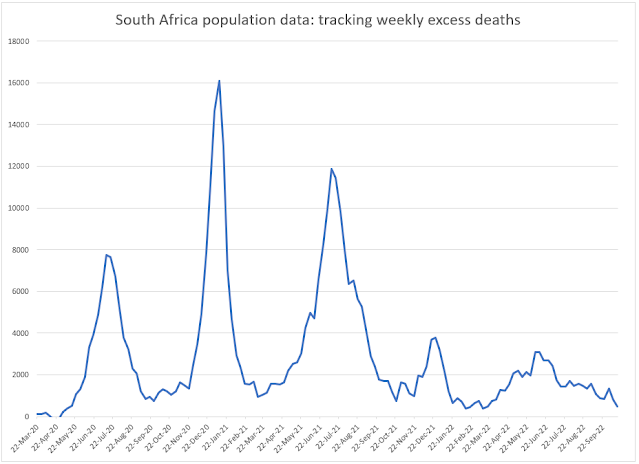
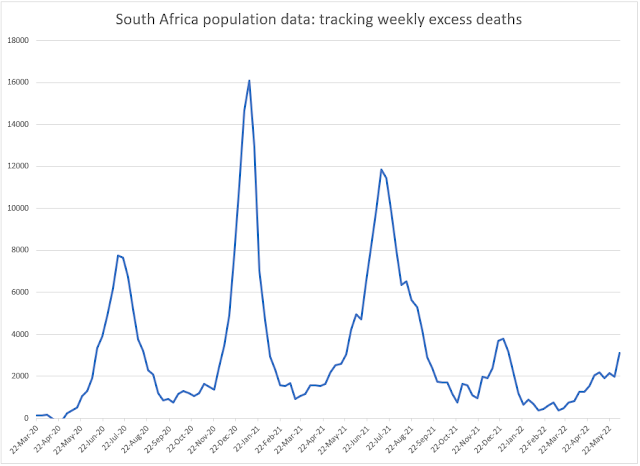
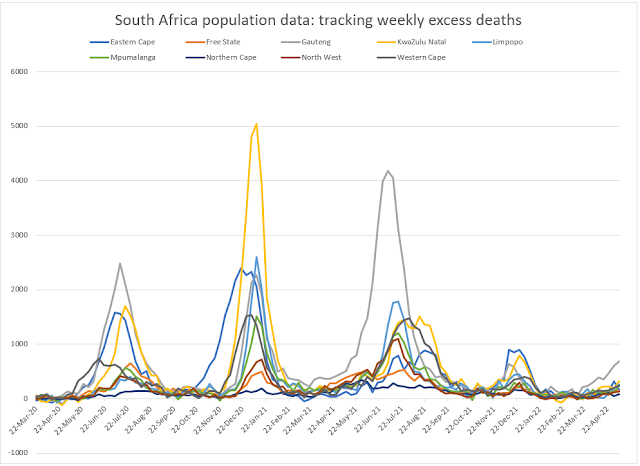
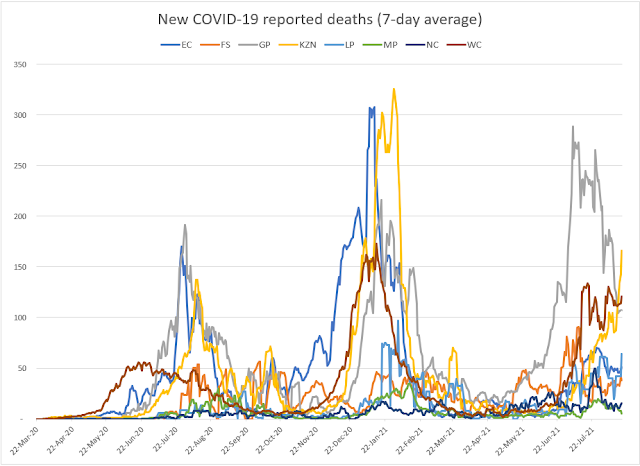
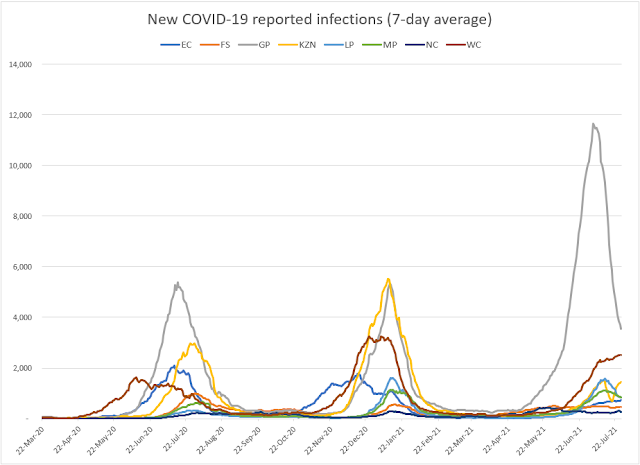
An analysis of the weekly deaths from natural causes as reported by the SA Medical Research Council (SAMRC) shows evidence of elevated excess deaths over the winter months of 2022. The graph below shows the weekly deaths reported by SAMRC in excess of the average weekly deaths reported between 1 January 2020 and 15 March 2020.  The COVID-19 hospital deaths as reported by the National Institute for Communicable Diseases (NICD) would appear to follow a similar pattern to that shown by the SAMRC excess deaths but with a more muted 5th wave. Anecdotally, the number of COVID-19 cases appear to be on the rise in South Africa although COVID-19 cases are no longer reported on a regular basis (outside of a hospital setting).  The above graphs show that the COVID-19 disease severity is certainly not near the levels experienced in the first three waves. 4 November 2022

Are we in for a heavy flu season in South Africa?

Image
The latest data on weekly deaths from natural causes by the South African Medical Research Council shows a sharp uptick. The graph below plots the weekly deaths in excess of the average reported between 1 January 2020 and 15 March 2020 (the period not impacted by COVID-19). There is no evidence of an uptick in either reported COVID-19 deaths or reported COVID-19 hospital admissions. It would then appear as if this uptick is due to a greater impact of seasonal flu. A number of commentators have warned against this given the absence of seasonal flu infections in 2020 and 2021 resulting in reduced natural immunity in the population. 20 June 2022

Is the 5th wave over (already)?

Image
The latest data from the NICD website on test positivity rates shows that the 5th wave is on its way down having peaked at a little over 27%.  The picture of new confirmed COVID-19 cases is also encouraging (see below). The much lower peak in the 5th wave could be the result of smaller numbers testing.  Equally encouraging is the data on hospital admissions of patients who tested positive for COVID-19. The latest data would indicate that hospital admissions have also reached a peak (and one considerably lower than the peak in the 4th wave) 26 May 2022

The 5th wave deaths are starting to show

Image
The latest data on deaths from natural causes released by the SA Medical Research Council are for the week starting on 5 May 2022. The graph below plots these deaths against a base-line calculated as the average weekly deaths reported prior to the pandemic in 2020. The plot of excess deaths shows a clear uptick in Gauteng that has already reached the maximum level recorded in the 4th COVID-19 wave. The excess deaths for Gauteng are still a way off the maximum recorded in the 3rd wave (but they should be monitored closely) An analysis of COVID-19 hospital admissions as reported by the National Institute for Communicable Diseases also shows a spike in the admissions for Gauteng. It is still early days but the signs are concerning. 19 May 2022

A short stumble in the 5th wave

Image
The percentage of COVID-19 tests that came back positive has plateaued at just over 20% this week. A similar stumble in the test positivity percentages was evident in the earlier waves and we should expect the rate of infections to continue their upward trajectory next week. If this does not happen, we could see a much lower level of infections in the 5th wave than we saw in the 4th wave in South Africa. The increase in confirmed cases continues to lag behind the test positivity percentage as a measure of the 5th wave. 6 May 2022

The start of the 5th wave

Image
The start of the 5th wave of COVID-19 infections can be seen when plotting positive test results. Test positivity has jumped to almost 20% in the four days ending 27 April 2022. The graph below plots a 4-day moving average of the ratio of new confirmed cases over new tests conducted as reported by the National Institute for Communicable Diseases (NICD).  The uptick of new confirmed COVID-19 infections is lagging slightly the uptick in the positive test percentages. The graph below plots a 4-day moving average of new confirmed cases. While there is little doubt that we will experience a 5th wave of infections, the disease severity caused by the infections will be key and must be monitored closely. 28 April 2022

4th Wave profile is emerging

Image
With the weekly new COVID-19 infections having peaked on 15 December, we are now in a position to understand the severity profile of the 4th wave. The good news is that the 4th wave disease severity as measure in terms of hospital admissions is 2/3rd of that experienced in the 3rd wave. The 4th wave disease severity as measured in terms of reported deaths is only 15% of that experienced in the 3rd wave. Weekly COVID-19 hospital admissions reached a peak some 12 days after the peak in infections at a level of 2/3rds of the 3rd wave peak. The new COVID-19 weekly deaths show signs of having peaked but only at a level equivalent to the weekly deaths experience between the 2nd and 3rd waves. Reporting delays may well be distorting these results! 4 January 2022

The 4th wave is here

Image
The 4th COVID-19 wave in South Africa is already worse than the earlier waves when measured in terms of new daily infections as can be seen from the graph below: What is equally concerning is that COVID-19 hospital admissions are following the infections upward. Many commentators were hoping for a lower disease severity in the 4th wave. This may well still be the case but the data over the last week reminds us that it is too early to make this call. 16 December 2021

No sign of the fourth wave (yet)

Image
Even though the Minister of Health is quoted as saying that the fourth wave is inevitable, there is no sign of it as yet in the data. The graph below plots the new COVID-19 reported infections by province: The graph of new COVID-19 reported deaths paints a similar picture: 16 November 2021

Time to consider the 4th wave?

Image
We have updated the NMG model to consider various scenarios for the 4th wave of COVID-19 infections for South Africa. You can access the model at  https://nmg-covid-19.sctechnology.co.za/ It will take a sustained viral propagation above a threshold speed to generate a noticeable 4th wave. The first 4th wave scenario is displayed below assuming a viral propagation speed of Rt = 3.0 for a period of 100 days starting on 15 October 2021.  The second scenario shows the impact of a viral propagation speed of Rt = 4.0 for the 4th wave. It is important to note that to reach Rt = 4.0 in the current South African population would require a viral strain with a basic reproduction number of over 12 (some four times the speed of the original SARS-CoV-2 virus). This calculation is based on the NMG model, where some 67.5% of the South African population is assumed to have built up immunity to reinfection due to infection over the first three waves.  A material 4th wave could be caused by a viral strai

The third wave is over

Image
Data on new COVID-19 reported infections shows that the third wave is now past the peak in all provinces. The third wave has been relatively extensive in Gauteng and the Western Cape when compared to the second wave. This pattern is confirmed when we consider hospital admissions and reported deaths:

COVID-19 deaths start to mount up in the Western Cape

Image
COVID-19 deaths for the Western Cape continue to be reported at levels close to the peak reached in the second wave. The accumulated deaths are starting to mount up in this province. This pattern is supported by the reported COVID-19 hospital admissions - see graph below: 31 August 2021

Is the third wave less deadly?

Image
KwaZulu Natal has overtaken both Gauteng and the Western Cape in the number of reported COVID-19 deaths. However, the deaths in KwaZulu Natal are still well off the peak experienced in the second wave.  The modeling done by NMG shows that the reported COVID-19 deaths are still lagging way behind what is projected for the third wave based on the reported infections. This would indicate that the likelihood of dying if infected in the third wave has not been as high as for the first two waves. This may be due to greater levels of prior exposure to the virus of those infected due to either vaccination or prior infection. It could also be the result of more effective medical treatment. 19 August 2021

Third wave has reached a plateau in the Western Cape

Image
The third wave appears to have reached a plateau in the Western Cape at a level equivalent to that attained in the second wave. COVID-19 infections are still on an increasing trend in KwaZulu Natal. The trend in COVID-19 hospital admissions and deaths as graphed below would suggest that the third wave has reached a plateau in the Western Cape at a level that is marginally lower than that achieved in the second wave.   12 August 2021

The third wave in the Western Cape

Image
The daily reported COVID-19 infections in the Western Cape have overtaken those in Gauteng, and show no sign of having reached a peak. This pattern is also evident in the comparison of reported COVID-19 hospital admissions: We have adjusted the duration of the third wave modeling in the Western Cape to better fit the data.  4 August 2021

The third wave in the Western Cape must be monitored

Image
The reported COVID-19 infections continue on their downward trajectory for Gauteng. However, the patterns for the Western Cape and KwaZulu Natal need to be monitored. The missing week in the reported infections (due to the civil unrest) for KwaZulu Natal is clearly evident in the graph below. The graph of reported COVID-19 hospital admissions set out below shows the trajectory of the third-wave for the Western Cape.  Our projections for the third-wave in the Western Cape may be too optimistic as can be seen from the graph below. We will monitor the data on hospital admission for the coming week and decide whether to recalibrate the NMG model. 28 July 2021

Is the third wave is on its way down?

Image
A graph of reported COVID-19 infections shows that the third wave has reached a peak in most provinces. For Gauteng and KwaZulu Natal, the reduction in reported infections will however have been impacted by the closure of health facilities in the wake of the civil unrest in these provinces. The sharp downturn in infections in Gauteng and KwaZulu Natal is not reflected in the statistics on reported COVID-19 deaths. Reported deaths might be a better indicator for the third wave in these provinces. The NMG model forecast for COVID-19 deaths shows that the third wave is still on an upward curve for the country as a whole. The reported deaths are tracking this forecast for now. 21 July 2021

COVID-19 death toll increases in Gauteng

Image
The third wave shows no sign yet of reaching a peak in Gauteng and, equally as worrying, the reported COVID-19 deaths have gone past the second-wave peak in this province. The gradient of the third wave in the Western Cape would appear to indicate that the Delta variant has not yet spread beyond Gauteng. Reported COVID-19 deaths have gone past the second-wave peak in Gauteng which is of concern Reported COVID-19 hospital admissions in Gauteng are showing signs of plateauing at a level equivalent to the second-wave peak in that province. This is almost certainly due to having reached hospital capacity. 7 July 2021

Update on the third wave

Image
The new COVID-19 infections in Gauteng are twice the level that they were for the first and second waves in this province. The steep gradient for the third wave appears to coincide with the spread of the Delta variant in Gauteng. While we can hope that this variant does not spread to the other provinces, it is probably a vain hope. New COVID-19 admissions in Gauteng have reached the level recorded at the peak of the second wave. This could have more to do with hospital bed capacity constraining the numbers than evidence that the treatment is more effective with the third wave. The reported COVID-19 deaths in Gauteng appear to have peaked at a level lower than that recorded in the second wave which is encouraging. We must continue to monitor this metric as the pattern may be a result in reporting delays. 1 July 2021

The third wave is still on the rise in Gauteng

Image
The graph below shows just how much worse the third wave is in Gauteng when measured using new COVID-19 reported infections. The third wave in the Western Cape is following a similar pattern to Gauteng with a more gradual slope in the early stages. The graph below of new reported hospital admissions in Gauteng has not (yet) reached the levels seen in the second wave. The graph below that of reported COVID-19 deaths in Gauteng also shows a similar pattern of a lower peak than was seen in the second wave. There are a number of possible reasons for this: More efficiency in testing resulting in an increased number of reported infections Better treatment of those infected resulting in lower hospital admissions and deaths A delay in the reporting of hospital admissions and deaths that will result in a catch-up in the next few weeks 23 June 2021