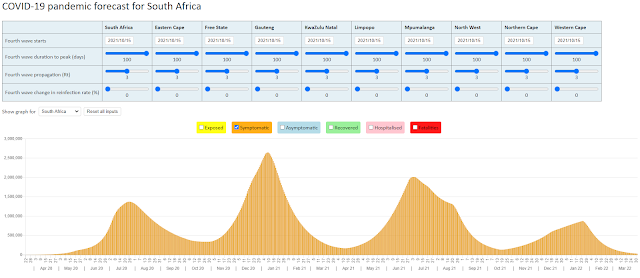
The third wave is still on the rise in Gauteng
The graph below shows just how much worse the third wave is in Gauteng when measured using new COVID-19 reported infections. The third wave in the Western Cape is following a similar pattern to Gauteng with a more gradual slope in the early stages.

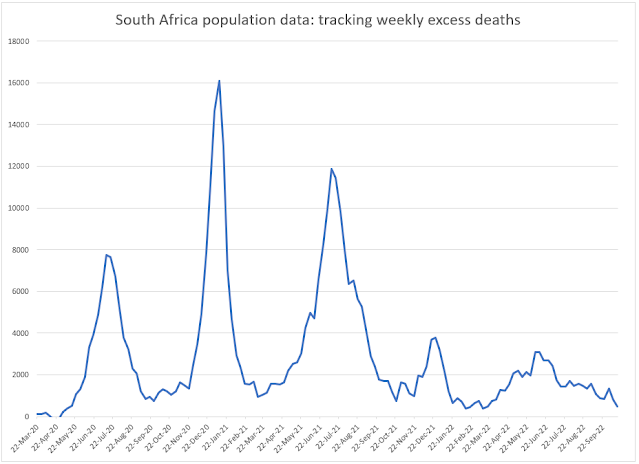
The graph below of new reported hospital admissions in Gauteng has not (yet) reached the levels seen in the second wave. The graph below that of reported COVID-19 deaths in Gauteng also shows a similar pattern of a lower peak than was seen in the second wave. There are a number of possible reasons for this:
- More efficiency in testing resulting in an increased number of reported infections
- Better treatment of those infected resulting in lower hospital admissions and deaths
- A delay in the reporting of hospital admissions and deaths that will result in a catch-up in the next few weeks


23 June 2021

Comments
Post a Comment