The start of the 5th wave
The start of the 5th wave of COVID-19 infections can be seen when plotting positive test results. Test positivity has jumped to almost 20% in the four days ending 27 April 2022. The graph below plots a 4-day moving average of the ratio of new confirmed cases over new tests conducted as reported by the National Institute for Communicable Diseases (NICD).

The uptick of new confirmed COVID-19 infections is lagging slightly the uptick in the positive test percentages. The graph below plots a 4-day moving average of new confirmed cases.

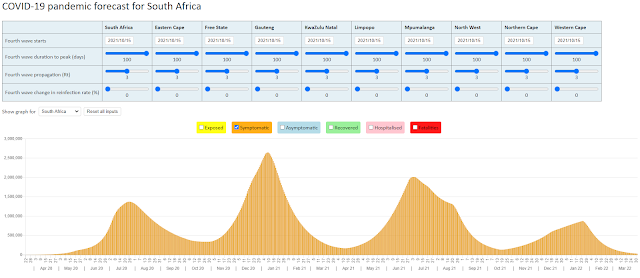
While there is little doubt that we will experience a 5th wave of infections, the disease severity caused by the infections will be key and must be monitored closely.
28 April 2022

Comments
Post a Comment