A different COVID-19 third wave for Gauteng
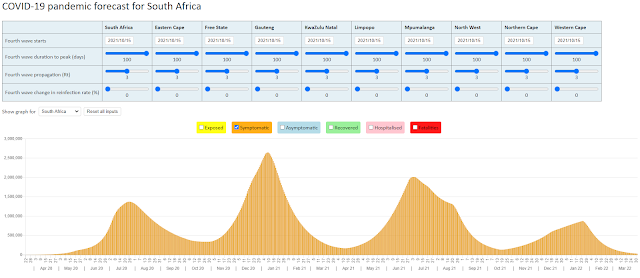
Daily new SARS-CoV-2 infections reported in Gauteng have reached a level of 25% of the number of new infections at the peak of the first and second waves. However, the shape of the third wave appears to be different from the shape of the first two waves. The graph below compares the daily new infections for Gauteng for each of the three waves as measured from the day that daily new infections first began to increase

The slope of the third wave of infections in Gauteng is flatter than the slope of the first two waves.
Some of the other provinces are also showing signs of an uptick in new infections. But the extent of the uptick and the size of the province, makes Gauteng stick out.


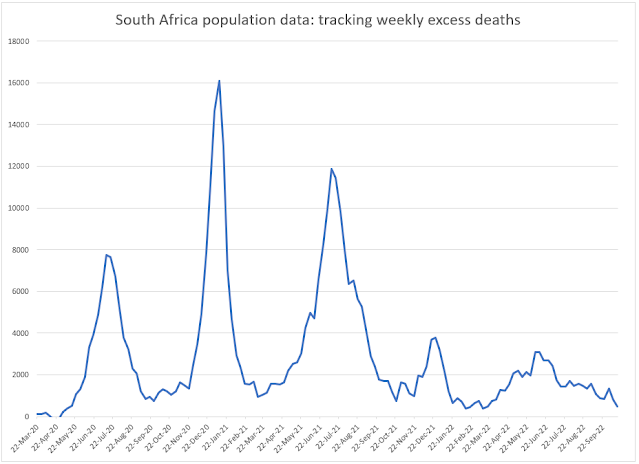
The reported COVID-19 hospital admissions and reported COVID-19 deaths also shows signs of a flatter third wave in Gauteng.


It is still early days, but there is hope for a flatter third wave for South Africa that will place less strain on our hospital system.
25 May 2021

This may be encouraging observations on two fronts, we may reach the
ReplyDelete1. peak of the third wave with fewer recorded daily cases
2. It might take longer to reach the apex of the third wave
This may mean that
1. The public health measures and current protocols are effective in flattening of the curve
2. The health system may enjoy more advance notice to stay ahead of the infections trajectory
3. The variants that drove the first two waves might have triggered some level of immunity to slow down the third wave