Will it all be over by February 2021?
The NMG model has been updated for the latest trajectory of the second wave of SARS-CoV-2 infections in South Africa. You can access the latest projections and an interactive web tool at https://nmg-covid-19.sctechnology.co.za/
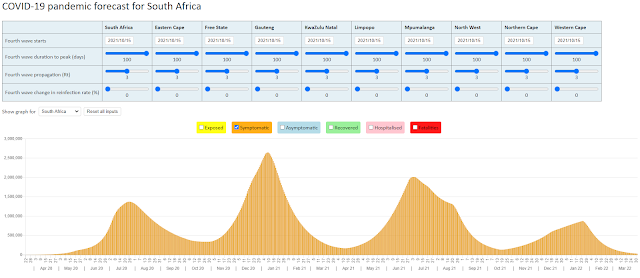
The shape of the second wave is evident from a screenshot from the interactive tool shown below:

This begs two questions:
- When will we reach a 'natural' herd immunity?
- Should we be targeting vaccinations at the 'not yet infected' group to reach herd immunity faster?
The key question to answer these two questions is:
- How much reliance can we have on the natural resistance against a second infection that our bodies develop having been infected with the virus?
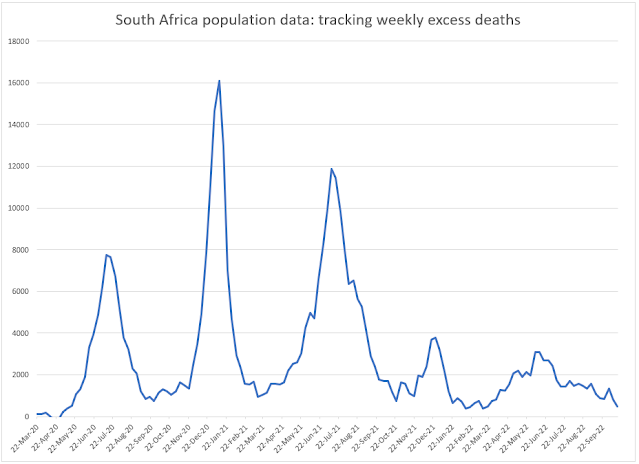
Our learning may well come from experience in a province like the Western Cape where reporting on COVID-19 has been more reliable and where the NMG model is forecasting that 60% of the population will have been infected in the first two waves. At the start of the pandemic, we expected herd immunity to be reached well before the infection levels reached 60%. The fact that this has not occurred could mean that the natural speed of propagation of the SARS-CoV-2 virus is faster than initially thought (this could well be the case with the latest strain of the virus).
Another explanation of the high infection levels might be that the natural resistance that our bodies develop on being infected with the virus is not as long-lasting as initially thought, and individuals are being infected more than once.
We should take time to look more deeply at these issues as there may be important lessons for how we roll out a vaccination program.
13 January 2021

Deaths in the WC already well ahead of the model on Saturday. Perhaps our CFRs are higher and the IFR from international studies (or CDC scenarios) you are adjusting for local age profiles is yielding too low a number. For example, see: https://www.timeslive.co.za/sunday-times/news/2021-01-17-death-rates-double-in-poor-areas/
ReplyDeleteI agree that we need to take another look at how the model forecasts COVID-19 deaths. Grossing up reported numbers by a factor of 1.8x for underreporting was always going to be problematic (what is the extent of underreporting changes over time?)
DeleteThis comment has been removed by the author.
ReplyDelete4,000 SA reinfections reported during the health briefing this evening (18th) so that might need to come into the model. Their definition seems to be two positive tests more than 90 days apart. 4,000 / 700,000 (approx known cases 90 days ago) is about 0.5% so may not be very insightful. PCR false positives could be in that range.
ReplyDeleteWe asked one of the medical scheme administrators to check the reinfection rates in the claims data. They came up with a % of less than 0.2% so not material for now. But we must keep an eye on this
Delete