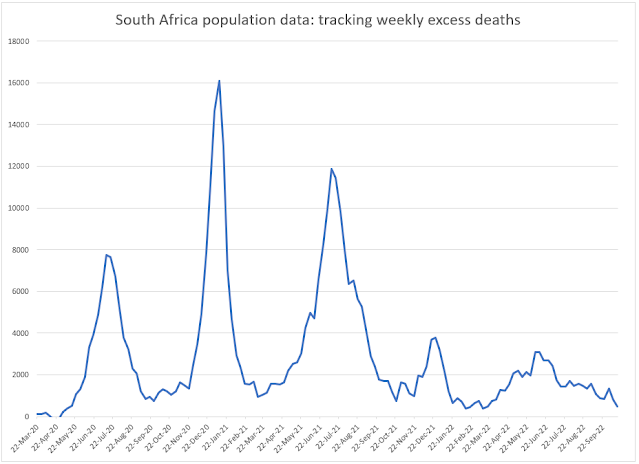
The second wave is indeed bigger than the first
Hospital admissions by COVID-19 positive patients have peaked above the numbers witnessed in the first wave of infections. The second wave experience is being lead by the Eastern and Western Cape and by KwaZulu Natal. The second wave could go even higher as the holiday makers return to Gauteng.
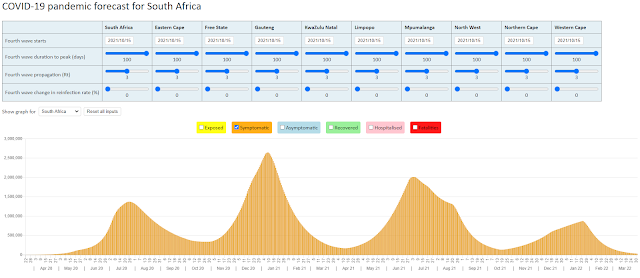
The graph below compares three forecasts from the NMG model with the 7-day average for new COVID-19 hospital admissions reported to the NICD.

The sero prevalence levels are forecast at 65% for the Eastern Cape, 60% for the Western Cape and 55% for KwaZulu Natal. The model used for the forecasting assumes that individuals will only be infected once. If this assumption is not accurate, then the second wave numbers could go even higher.
The protection that individuals have after a first infection is surely a key question to answer if we want to target herd immunity with a vaccine?
6 January 2021

Extra data on reinfections would be very helpful to enhancing modeling. SA NICD places a very high burden of proof on declaring a reinfection. But it would be very easy to report the number of distinct ID numbers reporting an infection via a PCR test more than 28 days apart. It could be made clear that these aren't necessarily reinfections but evidence of false positives, residual of old virus picked up at a high number of test cycles etc.
ReplyDeleteReinfections should they become a factor would change the modelling completely. We would then be dealing with successive waves that would recur and the pandemic would only lose its significance when the viral variants become less deadly.
ReplyDelete