COVID-19 mortality has increased in the second wave
The NMG model forecast for reported and unreported COVID-19 deaths would appear to be underestimating these deaths when compared against the reported numbers (with adjustment for unreported). But before we increase the Infection Fatality Ratio (IFR) in the model, I wanted to compare the model forecasts against the Medical Research Council (MRC) data.
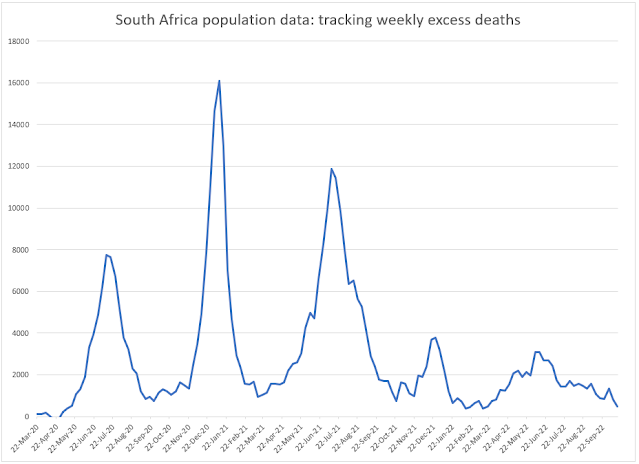
MRC report weekly deaths from natural causes for lives one year and older. Using this data, I have estimated MRC excess deaths as the weekly deaths above the average before COVID-19 (from 29 December 2019 to 21 March 2020). The graph below compares the MRC excess deaths for the Western Cape against the forecasts using the current NMG model and a revised NMG model.


In the current NMG model, the IFR assumption was reduced to 67% of the IFR derived from global experience. This reduction was implemented in June/July 2020 in light of evidence of improved ICU survival rates. In the revised NMG model, the IFR assumption has been increased back to 100% of the global experience from 1 December 2020 to coincide with the second wave of infections.
The impact of this change in the Eastern Cape is shown in the graph below. The Eastern Cape is the only other province that has a pattern of excess deaths with a second peak.

26 January 2021
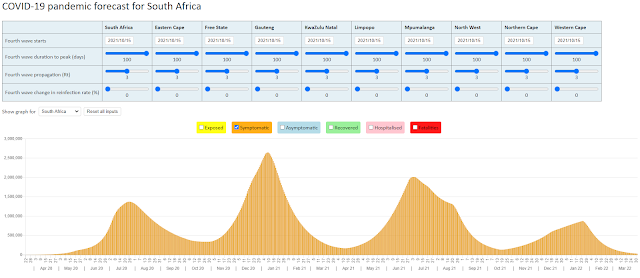

Latest model forecasts of about 2800 deaths per million in EC and 2200 in the WC make for pretty sober reading in a country with an average age of about 27!
ReplyDelete