Back to weekly modelling
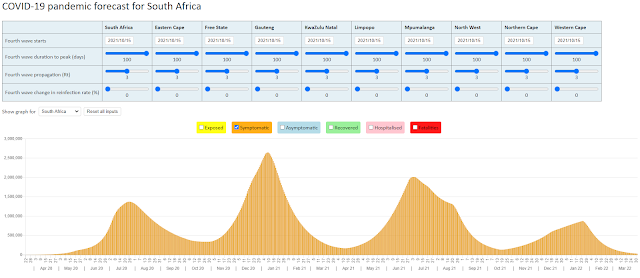
With a second wave of SARS-CoV-2 infections clearly underway in the Eastern Cape, and early signs of a second wave in other provinces such as the Western Cape and KZN, we have decided to revert back to updating the NMG model on a weekly basis. The latest NMG model can be found at https://nmg-covid-19.sctechnology.co.za/
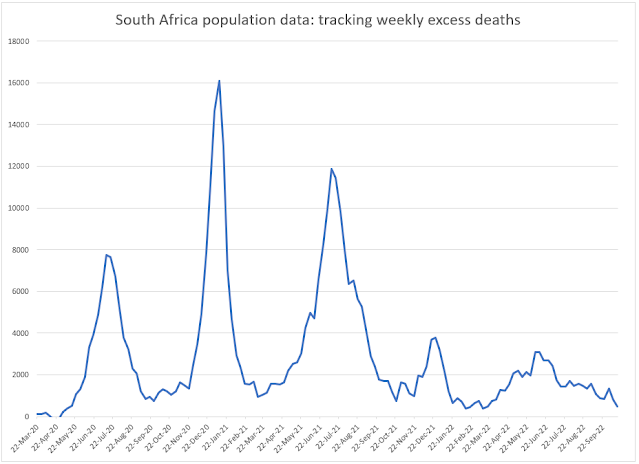
The graph below tracks the reported COVID-19 hospital admissions in the Eastern Cape showing the November spike in hospital admissions that can reasonably be termed a second wave:


December has always been identified as a make-or-break month for a second wave in South Africa as holiday makers make their way to the coastal provinces. We must then continue to monitor the hospital admissions for signs of a second wave.
26 November 2020

Comments
Post a Comment