Should we be thinking of a harder lockdown for South Africa?
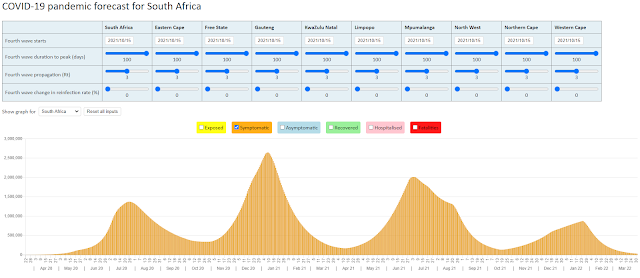
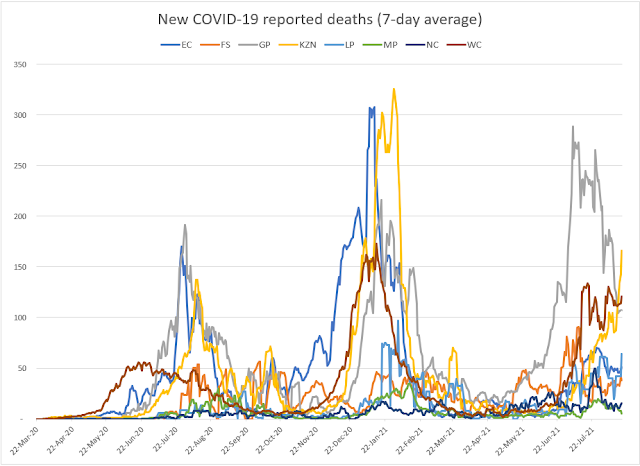
The daily COVID-19 deaths (7 day moving average) are compared against three projection scenarios using the NMG model in the graph below. The default scenario uses an attack rate of 25% for all of the provinces apart for the Free State where the attack rate was increased to 45% to fit the reported COVID-19 deaths in that province. The attack rate here refers to the percentage of the population that gets infected with the SARS-CoV-2 virus in the first wave of infections.
Let's start with the Western Cape where the reported COVID-19 deaths have been following the down slope of the 'first wave' in a somewhat predictable pattern. The NMG model uses an attack rate of 25% for modelling this first wave so there is still plenty of scope for a second wave in this province but there are no signs of this second wave when one considers the trend in reported deaths.
If we are to reconcile the two trends (in reported deaths and reported hospital admissions), we would need to further reduce the Infection Fatality Rate (IFR) in the NMG model. We introduced a 33% reduction to the IFR in June to account for a divergence between the reported deaths and hospital admissions, and a further reduction in September might be warranted (at least for the Western Cape).
A different picture emerges if we consider reported COVID-19 hospital admissions in the Western Cape. The hospital admissions would indicate that new COVID-19 cases continue to arise but not at a level that results in the exponential growth needed to form a second wave.
If we are getting better at treating the severe cases of COVID-19 that is indeed good news and would remove the pressure for a harder lockdown.
A continuation of COVID-19 cases following the first wave but at a level that does not result in a second wave is evident from the COVID-19 deaths in Gauteng. A factor of 1.8 times has been applied to the reported deaths to allow for COVID-19 deaths that go unreported in this province. This factor is derived from the Medical Research Council analysis of excess deaths and is the same for all provinces other than the Western Cape where a factor of 1.1 times has been used.
The analysis of daily deaths in KwaZulu Natal indicates a pattern of a second spike in infections that then peters out. The hospital system should be able to managed infection spikes like these unless there is an underlying improvement in the IFR that is masking the spike in hospital admissions as appears to be the case in the Western Cape. It is important to monitor reported COVID-19 hospital admissions to better understand this. This data is unfortunately only available to the public in the Western Cape.
A similar pattern arises in the Eastern Cape:
In the Free State, an interesting pattern of a series of successive infection waves emerges . The NMG model is not geared up to fit this pattern of infections as can be seen by the line graphs. What is also interesting about this province is the attack rate of 45% that was needed to 'fit' the reported deaths.
The other provinces of Limpopo, Mpumalanga, Northern Cape and North West are graphed together below. The NMG model has been fit using an attack rate of 25% for these provinces. There would still need to be a series of successive spikes of infection to reach these attack rates in these provinces.
30 October 2020


Don't succumb to Modelling Fatigue Gary! Your blogs and insights are fabulous and invaluable, and have helped many of us (not least your NMG colleagues) understand the virus and its impacts much better.
ReplyDeleteThanks for this, Gary. Very informative
ReplyDelete