What shape might a second wave take
The default parameters applied to the NMG model forecast that 22% of the South African population will have been infected in the first wave of COVID-19 infections. With this level of seroprevalence in a population, the likelihood of a second wave of infections is low, and the intensity of a second wave, should it occur, should be dampened. It is nevertheless useful to consider what shape a second wave might take should one occur in South Africa.
The NMG model has been extended to allow for the modelling of scenarios for a second wave of COVID-19 infections. You can access this model at https://nmg-covid-19.sctechnology.co.za/.
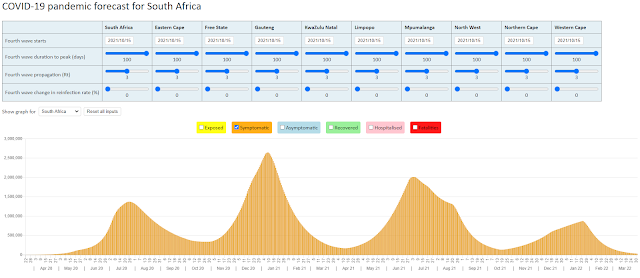
The graph below shows the number of infected lives in the South African population for four such scenarios for a second wave of infections. The first scenario is for a low intensity second wave where viral propagation increases to a level represented by a reproduction number of 1.00 from 1 October 2020. The other three scenarios are for a spike in infections on 15 December 2020 that lasts for 15 days, 30 days and 45 days respectively. Viral propagation during the spike is assumed to increase to a level represented by a reproduction number of 2.60.

It is useful to recap how the NMG model forecasts the number of lives that become infected by the virus. At the start of the pandemic the entire South African population is assumed to be susceptible to infection and will become infected if they come into contact with an infectious life. The model uses a reproduction number to determine how many lives are infected by one infectious life. A reproduction number of 1.00 means that each life that gets infected with the virus will infect one susceptible life.
A reproduction number of 1.00 should then keep the numbers infected by the virus at a constant level in the population. This is not however the case if we look at the line for the low intensity second wave scenario in the graph above. The reason for this is that the NMG model applies a reduction factor to the reproduction number calculated as the ratio of susceptible lives to the total population. At the end of the first wave according to the NMG model, 22% of the South African population will have been infected by the SARS-CoV-2 virus and no longer be susceptible to infection. The reproduction number of 1.00 is then reduced by the ratio of susceptible to total population to give an effective reproduction number of 0.78. The literature refers to a basic reproduction number (1.00 in this case) and an effective reproduction number (0.78).
This adjustment makes it more difficult for the virus to move through a population where a large part of the population has already been infected and therefore has immunity. For the numbers of infected lives to reach a constant level in the South African population after the first wave, the viral propagation needs to increase to a level represented by a reproduction number of 1.28 (1.28 x 0.78 = 1.00 with rounding).
The three scenarios for a spike in infections show that for a second wave to establish itself the viral propagation would need to speed up materially and then maintain that speed of propagation for a sustained period. Effective measures to mitigate the risk of a second wave would be (1) to avoid super-spreading events that could generate a speed of viral propagation that could be dangerous and (2) to implement an effective track and trace system for those who do get infected to slow down the propagation. It should be possible to open up the economy and still have these measures in place.
3 September 2020

Comments
Post a Comment