Version 2 of the Actuarial Society COVID-19 model was released on Tuesday
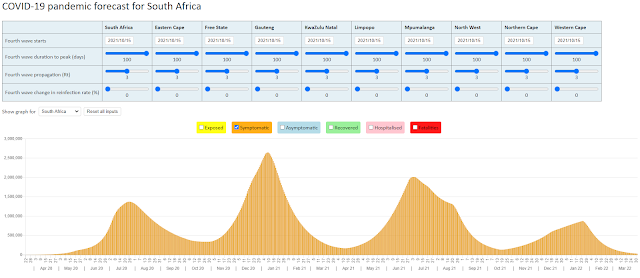
The Actuarial Society of South Africa (ASSA) released version 2 of their model on Tuesday and I attended a most interesting presentation on the model and broader issues related to the COVID-19 pandemic. The model itself and the accompanying paper are very impressive and well worth a read.
However, the model does little to assist anyone trying to come up with a better understanding of how the pandemic might play out in South Africa over the next two months, six months or twelve months.
The paper sets out 30 scenarios for the pandemic in South Africa but with a disclaimer that the scenarios do not represent a range of possible outcomes but rather the impact of varying the key parameters used by the model.
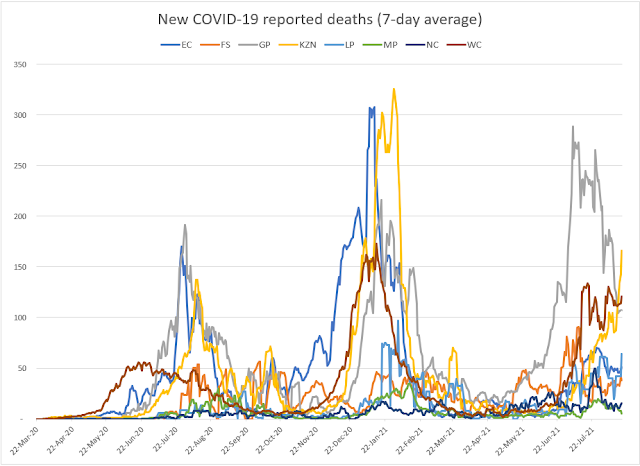
The graph below compares the 7-day average of daily reported COVID-19 deaths for each of the 30 ASSA model scenarios with the NMG model run using the default parameter assumptions. The NMG model is shown as the red dashed line. The actual reported deaths are also plotted.
What is evident from the comparison is that none of the 30 ASSA scenarios give similar results to the NMG model and that the NMG model results are at the low end of the scenarios given.
The paper accompanying the ASSA model includes a section where they highlight four specific scenarios that 'broadly reflect the range of views held by actuaries who have contributed to the research'. These four scenarios are compared to the NMG model in the graph below:
If I ignore the two extreme scenarios and compare the middle two scenarios with the NMG model, I could conclude that we are perhaps being a little optimistic with the NMG default parameter assumptions. It is always good to be aware of this possibility and we will need to monitor the data closely over the next few weeks to see if daily reported deaths have indeed peaked (as forecast by the NMG default parameters).
What is interesting is that all four scenarios show the pandemic as largely over by Christmas. While there is a risk of a second wave, the extent of the infections forecast in the scenarios for the first wave would make a significant second wave less likely.
14 August 2020


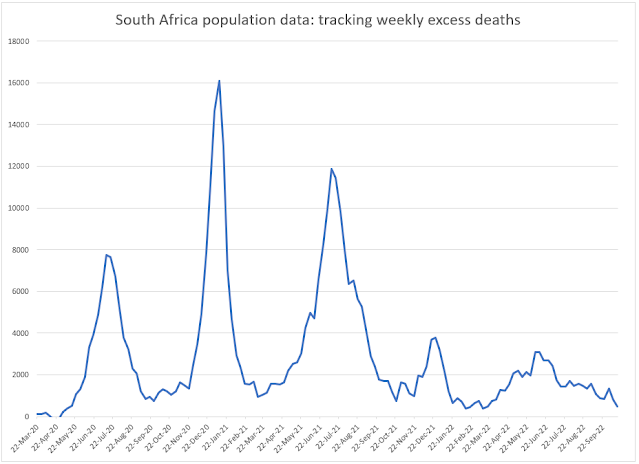
Thanks, wonder whether specific provision should be built in all models for excess deaths, also given differential reporting, rgds
ReplyDeleteI have come to the same conclusion after seeing the reported deaths in Gauteng falling way short on the Western Cape. The latest release of the NMg model makes this adjustment
Delete