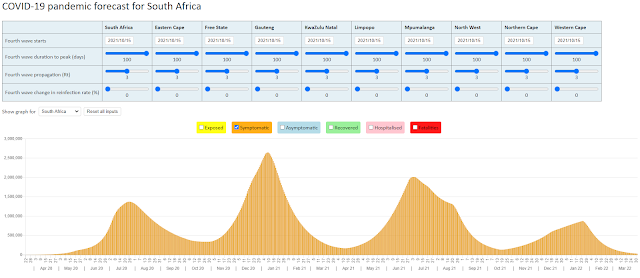
This is how the first wave is shaping up
The first waves of COVID-19 reported deaths are taking on different shapes in the top four provinces. The latest calibration of the NMG model looks as follows:

The waves for Gauteng and KwaZulu Natal appear much narrower than those for the other two provinces. This has resulted in a lesser proportion of lives forecast as having been infected with SARS-CoV-2 in these two more densely populated provinces.
The percentages infected in the first wave as implied by the NMG model is as follows:
Western Cape: 25% infected
Eastern Cape: 20% infected
Gauteng: 15% infected
KwaZulu Natal: 10% infected
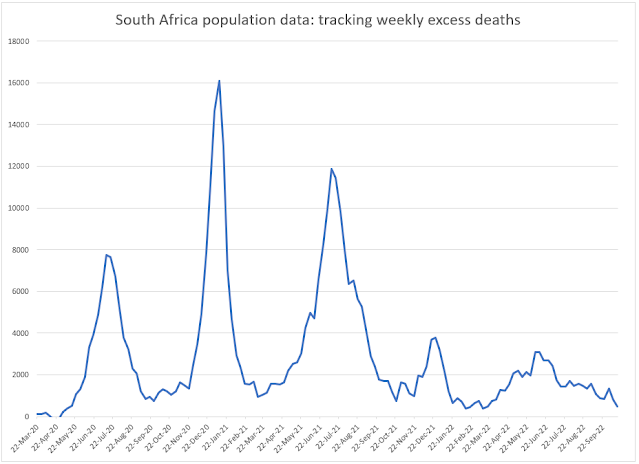
The Medical Research Council (MRC) report on deaths from all natural causes and this is a useful check on the assumptions made in the NMG modelling of the pandemic. The graph below compares the weekly deaths from natural causes for lives aged one year and older (1 + yr).

The MRC data for the Western Cape would indicate that the impact of COVID-19 was earlier and more prolonged than in the other provinces. The level of natural deaths is, however, much lower for the Western Cape.
The MRC data for Gauteng, KwaZulu Natal and the Eastern Cape would appear to follow a similar pattern to that forecast for COVID-19 deaths in the NMG model.
I must now turn to the thorny subject of second waves and how to model them.
23 August 2020

Your default IFR assumption looks on the high side given meta analyses such as https://www.medrxiv.org/content/10.1101/2020.07.23.20160895v3 SA age strat applied to that data yields an IFR of about 0.47 and most of their input data pre-dates dexamethasone and other treatment improvements. % infected may therefore be higher than estimates. Calibrating to excess deaths for interest would show a yet higher % infected.
ReplyDeleteThe default IFR assumption in the NMG model ranges from 0.314% for the youngest province to 0.505% for the oldest. Note that this is after we have applied a factor of 0.67 to the IFR's to reflect the improvement in ICU survival rates.
DeleteThanks - couldn't see that from the province level inputs section of the model page which seem to range from .74 (EC) to .47 (Gauteng) but maybe I am missing something.
DeleteYes apologies for this it is not clear from the model page (you need to read the full report)
Delete