Thinner first wave infections in Gauteng and KwaZulu Natal
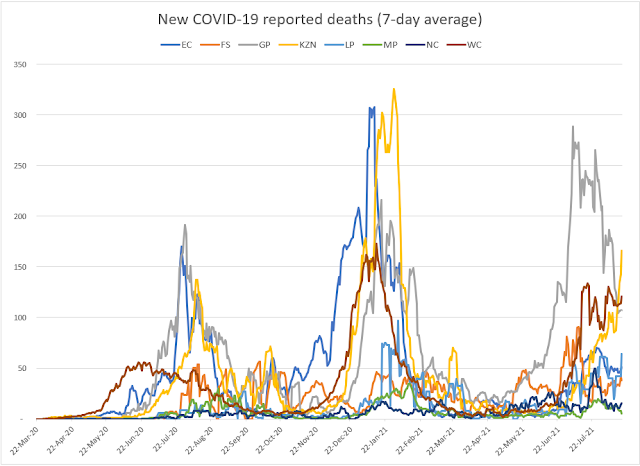
When updating the NMG model yesterday with the latest week's data, I noticed that the reported deaths for Gauteng and KwaZulu Natal were coming down at a much faster rate than the model is forecasting. For both provinces, it looks as through only 12% of the population will be infected by the first COVID-19 wave and not the 20% used in the model.
The first waves in the Eastern Cape and Western Province are still on track to infect 20% and 25% of their respective populations. I am a little puzzled by this and want to monitor the trend in Gauteng and KZN for one more week before changing the parameters for the NMG model.
The latest graph of reported daily deaths in Gauteng against the three NMG model scenarios is shown below:
The equivalent graph for KZN is shown below:
This coming week will be spent looking at how best to model COVID-19 infections in 2021, and I will be looking at second COVID-19 wave experiences in other geographies. I would have thought that the percentage of the population infected in the first wave should have a bearing on the numbers infected in a second and subsequent waves. First we need a theory to explain the first wave experience in Gauteng and KZN!
20 August 2020


Comments
Post a Comment