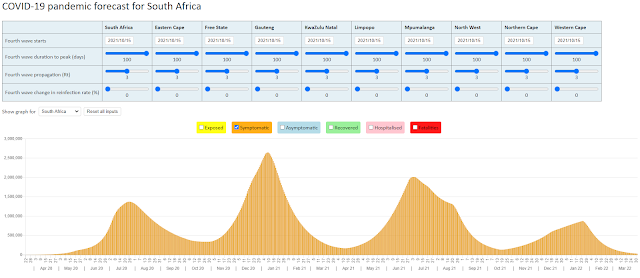
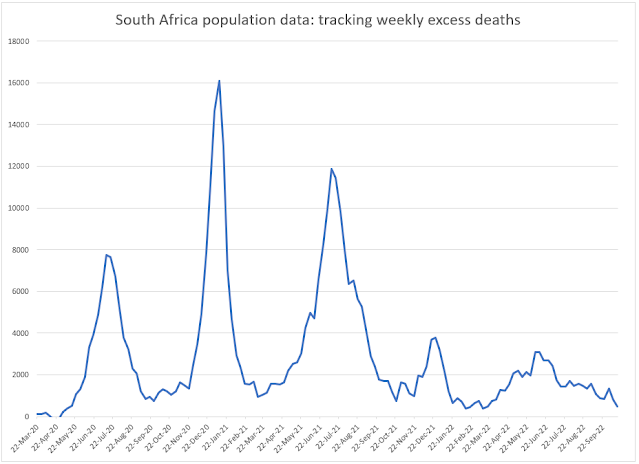
It would appear that daily COVID-19 deaths have peaked in South Africa?
The 7-day moving average of daily COVID-19 deaths are plotted against three scenarios from the NMG model in the graph below. As you can see, our inherent assumption is that daily deaths have peaked in South Africa and what is left is to determine the nature of the peak (pyramid, bowl-shaped or table-top).

Off course we could always be wrong, but what you have is our best guess based on what we are observing in the provinces. Let's take a look at the four large provinces in turn.
Daily deaths in the Western Cape are taking their time to come down from their peak and this last week saw a spike in reported COVID-19 deaths. This caused us to revise our default '% population infected' assumption from 20% to 25% for the Western Cape.

We have daily reported statistics on COVID-19 positive hospital patients in the Western Cape. The patients in ICU provides a useful check on the daily reported deaths. The graph below compares ICU patients against daily deaths x 5. From this comparison, the spike in reported deaths last week would appear to be just that (rather than the start of a trend).

It is still early days, but the results for Gauteng are encouraging with indications that daily deaths peaked at just over 100. The steep downward slope gives no indication that more than 20% of the population in this province will be infected in the first COVID-19 wave. We have therefore retained our default assumption at 20% but may well need to revise it downwards should last week's tend continue.

The Eastern Cape has presented challenges with reporting delays. The peak at over 90 daily deaths is almost certainly related to these delays. There was another spike in reported deaths last week and if this continues we may need to revise our default assumption upwards. For now, we have left it at 20%.

KwaZulu Natal saw daily deaths increase to just below 80 in the last week. We will need another one or two weeks of data before having more confidence in the default assumption. For now we have also left it at 20%.

Just as I was beginning to feel that we are getting on top of the modelling of the pandemic in South Africa, the Actuarial Society released version 2 of their model that would appear to show a very different picture. It is always good to be reminded of the extent of the uncertainties associated with forecasting an event as novel as this one.
I am attending a presentation on the Actuarial Society model later today, and will then look at the differences in my next blog.
13 August 2020

Comments
Post a Comment