A closer look at the Western Cape hospital data
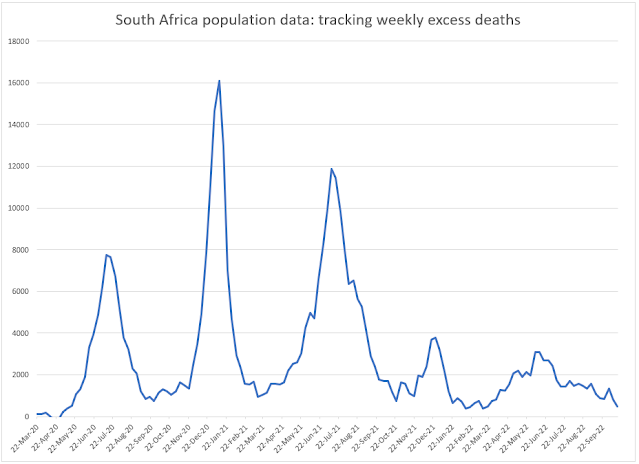
When we model the pandemic we use daily reported COVID-19 deaths to set the parameters for the model. The 7-day moving average of daily deaths in the Western Cape has followed a wave pattern of a steep slope up with a more gradual slope down. The pattern using reported deaths to 21 July is set out below:


The Western Cape Premier, Alan Winde, publishes hospital statistics on a daily basis, and the total patients in hospital follows a similar wave pattern.

Interestingly, patients in High Care and ICU follow a slightly different pattern with the patient numbers reaching a plateau without yet showing signs of coming down.

Discovery has identified an improvement in survival rates of COVID-19 patients in ICU from their data. This would explain the pattern in the Western Cape of falling General Ward patients while High Care and ICU patients stay at the same level.
We need to then contemplate an improving infection fatality ratio in our COVID-19 projections going forward.
23 July 2020

Comments
Post a Comment