We have three actuarial models for the pandemic in South Africa. What do they teach us?
There is so much we don't know about the SARS-CoV-2 virus, how it spreads and what causes the COVID-19 response in humans, that it is foolish to try to build models to forecast outcomes like infection rates, hospitalisations and deaths. Yet we have three models for the South Africa pandemic built by various people within the actuarial profession, one of which I have been involved in. There are other models (some of which are being used by Government to assist with policy making), but these have not been made public.
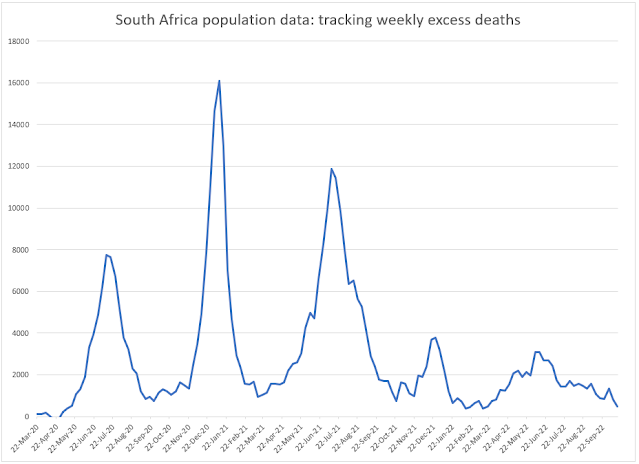
 What appears to happen when a geography starts to experience infections, sickness and death at the level that New York City has is that the R0 falls below 1.00 and the virus stops spreading. It is the change in behaviour of the population (people staying indoors, practicing social distancing, wearing masks etc) that causes the R0 to fall, and when this behaviour changes back, the virus will begin spreading again and there will be a second wave of infections.
All three models contain projections for the number of deaths caused by COVID-19 in South Africa. The Actuarial Society model sets out four 'baseline' scenarios showing forecasts of deaths ranging from 48 300 to 88 000. The model by a group calling themselves PANDA, sets out three scenarios for 'potential total deaths' of 20 000, 40 000 and 88 000. The latest version of the NMG model provides a forecast for total deaths of 176 000.
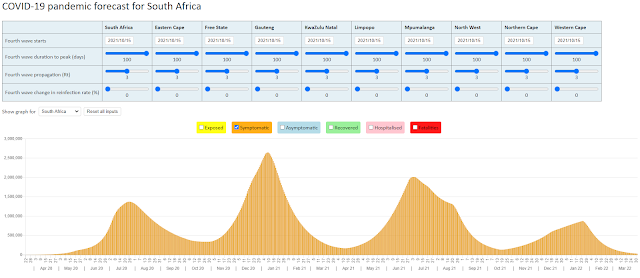
The NMG model is a multi-state model that categorises the South African population of some 59 million lives into a number of states depending on whether they have been exposed to (infected by) the virus, have symptoms, are infectious, recover, die or never become infected. The model rolls the population forward each day by moving lives through the various states. Deaths from COVID-19 are forecast according to an Infection Fatality Ratio (IFR) that is based on international studies with adjustment for the South Africa experience. The latest model uses an IFR of 0.506% and this is applied to the lives that are infected with the virus and show symptoms of COVID-19. Asymptomatic lives are assumed not to be at any risk of dying. The NMG model assumes 31% of infected lives will be asymptomatic.
The NMG model follows the logic of the SEIR modelling that has been used by Imperial College London and others. The SEIR logic has two important assumptions about the pandemic that are built into the NMG model; the first that assumes that all lives in the population are equally susceptible to being infected by the virus and the second that assumes that once a life is infected by the virus they will have immunity from further infection (at least for the duration of the model). These are two important assumptions that I will come back to later.
First, I want to explore the relationship between the speed of spread of the virus in a population and herd immunity. Herd immunity is reached when there are enough lives with immunity in a population that the virus cannot find a host to infect and then dies out. In the SEIR logic and in the absence of a vaccine, herd immunity is directly related to the speed of the spread of the virus in a population. According to the NMG model, the current rate at which the virus is spreading in South Africa is at a speed of 1.86 new infections for each infected person (or an R0 of 1.86). At this speed, the model shows the virus infecting 86% of the population, or some 51 million lives. If the speed at which the virus spreads can be reduced, to say an R0 of 1.20, then the virus will infect 60% of the population before dying out. This is what people are referring to as 'flattening the curve'. If we are able to reduce the R0 from 1.86 to, say, 1.20 then we will have (a) delayed the rate at which people become infected and (b) reduced the number of people that will eventually become infected. (as an aside, it is looking as though this level of reduction in the R0 is not possible given our situation in South Africa).
With that background,we can now show how the NMG model has forecast total deaths from COVID-19 at 176 000. The arithmetic is as follows: 59 million x 86% x (100% - 31%) x 0.506% = 176 000. OK so we don't quite get to the 176 000 but we can blame this on rounding. We can now also understand (at a high level) the differences between the Actuarial Society model and the NMG model. The Actuarial Society model uses an assumption that 75% of infected lives will be asymptomatic for their forecast for total deaths of 48 300 and an assumption that 50% of infected lives will be asymptomatic for their forecast of 88 000 deaths. If I run the NMG model with a 75% and 50% assumption for asymptomatic lives, I get revised forecasts for total deaths of 39 700 and 115 000 respectively.
As an aside, the reason you cannot simply replace the 31% (with 75% or 50%) in the simplified formula for deaths given above, is because the speed of the spread of the virus is impacted by the change in the assumption for asymptomatic lives. The NMG model (and the Actuarial Society model) assumes asymptomatic lives will be less infectious.
The PANDA group uses as inputs to their model the Actuarial Society forecast for deaths of 88 000 and a figure for deaths of 40 000 obtained by extrapolating from the experience in New York City to South Africa.
We did our own modelling for the pandemic in New York City in mid April and concluded that some 30% of New Yorkers had been infected with the virus (https://modellingcovid-19.blogspot.com/2020/04/new-york-state-of-mind.html). From the latest data, it would appear as if New York City is over the first wave of the pandemic.
There is another explanation as to why the virus stops spreading in geographies such as New York City and that is that herd immunity is reached far earlier than predicted by what the SEIR models show. I explained earlier that one of the assumptions underlying the SEIR logic is that all lives in the population are equally susceptible to being infected by the virus. If this is not the case, and there is variation in individual susceptibility to infection by the virus, then the more susceptible sub-population will be infected first leaving a second sub-population that is better equipped to handle the virus. If it is the variation in susceptibility and not behaviour change that is the reason for the drop in the R0, then there will be no second wave of infections (or at least one that is not as catastrophic as the first).
The way in which the NMG model is constructed, makes it difficult to make an explicit allowance for the impact of variation in susceptibility of the population to the virus. One way to do this might be to increase the assumption for the proportion of asymptomatic lives in the model to the levels of 50% or 75% that is used in the Actuarial Society model.
9 May 2020

Comments
Post a Comment