Seven weeks of modelling COVID-19 for South Africa
The NMG model released today is the first release where the methodology being followed is exactly the same as that followed in the prior week. My first attempt at forecasting the impact of the pandemic for South Africa was conducted on 6 April. There were earlier models but they simply showed the impact of different input assumptions on the pandemic outcomes for South Africa. The model on 6 April was the first that used the reported experience for South Africa to set the input parameters for the model.
On 6 April, we forecast a total of 65 200 deaths from the pandemic in South Africa. Seven weeks later, our forecast for deaths has not changed much and is now sitting at 59 300. This narrative avoids the substantial detour where our forecast for deaths peaked at 176 000 based on the model inputs on 4 May.
It is interesting to take a look at how the methodology for both using the experience to set the input parameters and for the model itself has changed over the seven weeks. Let's start with the total COVID-19 deaths forecast by each of these models:
 |
It is instructive to take each of the key input parameters to the model and consider how these have changed over the seven weeks.
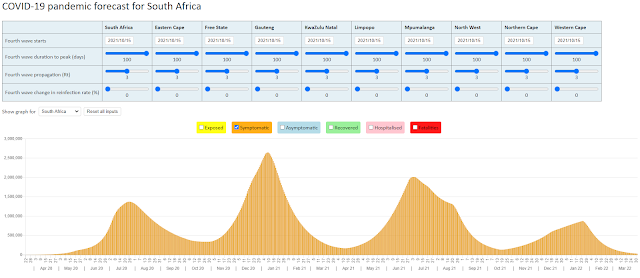
The reproduction number parameter is a measure for how quickly the virus propagates through the South African population. We use the pattern of confirmed cases reported since 22 March to set this parameter. Back on 6 April, a reproduction number of 1.43 was the best fit for confirmed cases. Since then there has been a general increase in the reproduction number and it has been set at 2.26 for the 11 May and 18 May models. The inability of lockdown to reduce the speed of the virus propagation has resulted in many commentators (including this one) calling for lockdown to end.
The 6 April model had an assumption that all symptomatic infections would be reported. The asymptomatic infections were set according to a study on the virus in WuHan China at 31% of the total numbers infected. The asymptomatic infections were treated as unreported. A major revision was made to the modelling methodology on 13 April whereby the symptomatic infections were split into reported and unreported. The 13 April change also used the Infected Fatality Ratio (IFR) derived from international studies to infer the number of unreported symptomatic infections by fitting the model to the reported deaths in South Africa. The fit to the reported deaths in the 13 April model, set the proportion of unreported infections (both symptomatic and asymptomatic) at 89%. The percentage unreported has remained largely constant since 13 April with the latest model showing 88% of infections unreported.
The IFR was derived from international studies and adjusted for the age distribution of the South African population in the 13 April model. This model used an average IFR of 0.490%. I become concerned that the South African IFR may not follow international patterns especially for the lives below age 60 due to the heavier disease burden in the South African population. A methodology was incorporated into the model to adjust the IFR for a change in the age-based pattern of COVID-19 deaths reported in South Africa. We have experienced some difficulties in obtaining the age-pattern of COVID-19 deaths in South Africa. Someone was kind enough to let me have the latest pattern from a 'secret source' for this latest 18 May model. The good news is that the South African deaths do appear to be largely following international age-patterns. The average IFR for South Africa was measured at 0.488% in the 18 May model.
The biggest change in methodology came with the 11 May model when we included a herd immunity parameter into the model. The 4 May model had no such constraint and projected 86% of the South African population becoming infected with the virus. While this would be a realistic projection for a population where all individuals were equally susceptible to infection, it is a gross overstatement for a population where the virus propagation is constrained by the social contact networks in place and where these networks differ according to the extent to which individuals are connected. A herd immunity parameter of 30% was selected for the 11 May model based on historical experience with past influenza pandemics (most notably the 1918 and 1957 pandemics) where around 30% of the population seem to have become infected.
As stated earlier the methodologies employed in the 11 May and 18 May models are identical. The 'best fit' forecasts from the NMG COVID-19 model might finally be settling down. In the report that accompanies the 18 May model, we have included a sensitivity analysis. This represents a first attempt at putting a lower and upper bound to the 'best fit' forecasts.
For anyone wanting to read the report accompanying the 18 May model, it is available at https://nmg-covid-19.sctechnology.co.za/
18 May 2020

This comment has been removed by a blog administrator.
ReplyDelete